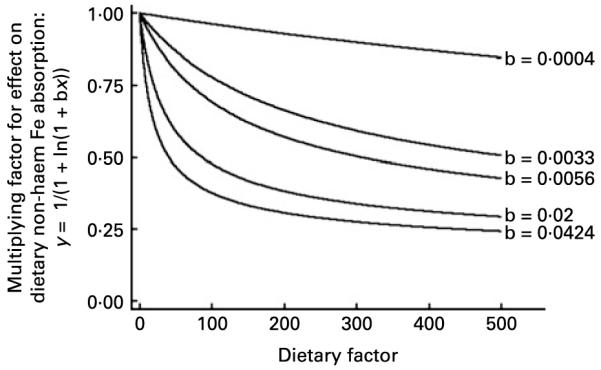
Fig. 2.

The effect of a dietary inhibitor. The function ‘y = 1/(1 + ln(1 + bx))’ is shown for example values of b. We selected this function to describe the effect of dietary inhibitors on dietary non-haem Fe availability in the algorithm designed in the present study. As shown in the Results section, the curve ‘b = 0·0424’ shows the precise fit for the relationship between dietary non-haem Fe intake (mg) and dietary non-haem Fe availability in this algorithm (i.e. inhibition of percentage Fe availability by Fe itself). Likewise, the line ‘b = 0·0033’ shows the precise relationship between non-haem Fe availability and phytate.
