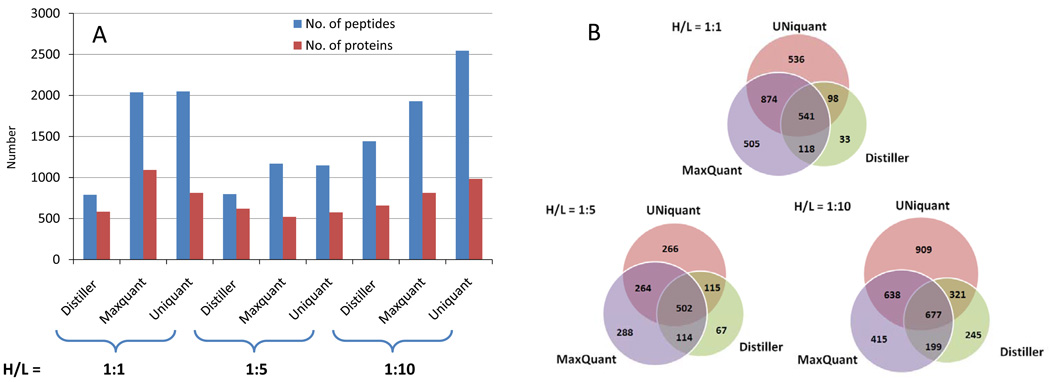
Figure 2.
(A) The number of peptides and proteins identified and quantified from complex proteome mixtures with known heavy/light (H/L) ratios (H/L = 1:1, 1:5, and 1:10) by Distiller, MaxQuant, and UNiquant, respectively. The H/L ratios of proteome mixtures are indicated at the bottom of the figure. (B) Venn diagram compares the number of peptides identified and quantified by Distiller, MaxQuant, and UNiquant, respectively. Three programs shows different coverage of standard proteome mixture in different mixtures (H/L = 1:1, 1:5, and 1:10).

