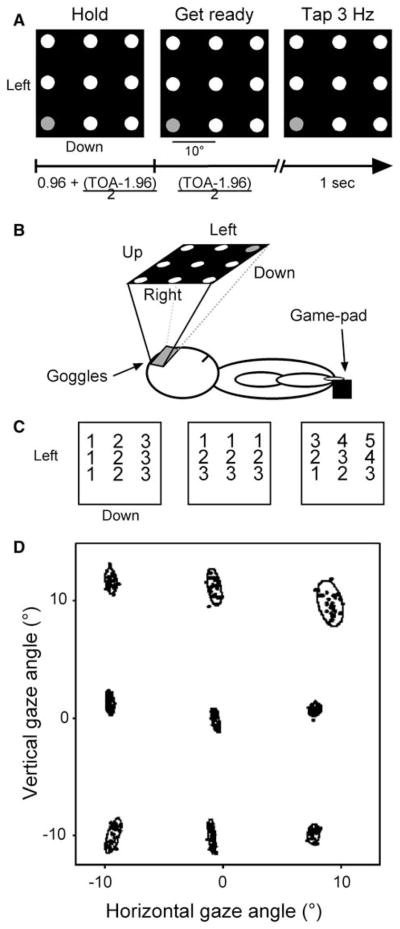
Fig. 1.
a Task schematic. Participants viewed nine targets and fixed gaze at 1 for 16 consecutive trials. In each trial the target’s color changed from red to yellow to green (left-middle-right panel for red-yellow-green, respectively) at which point the participant tapped three times with the right index finger. Trial-onset-asynchronies were 3.84, 4.8, 5.76, 6.72, or 7.68 s (random presentation). b Experimental set-up. Participants wore a pair of MRI compatible goggles and tapped with their right index finger. c Mapping of regression models for the horizontal (left), vertical (middle), and diagonal (right) dimensions. d Averages gaze positions for a subject for all trials as the target appeared green. See text for additional details

