
Figure 5.
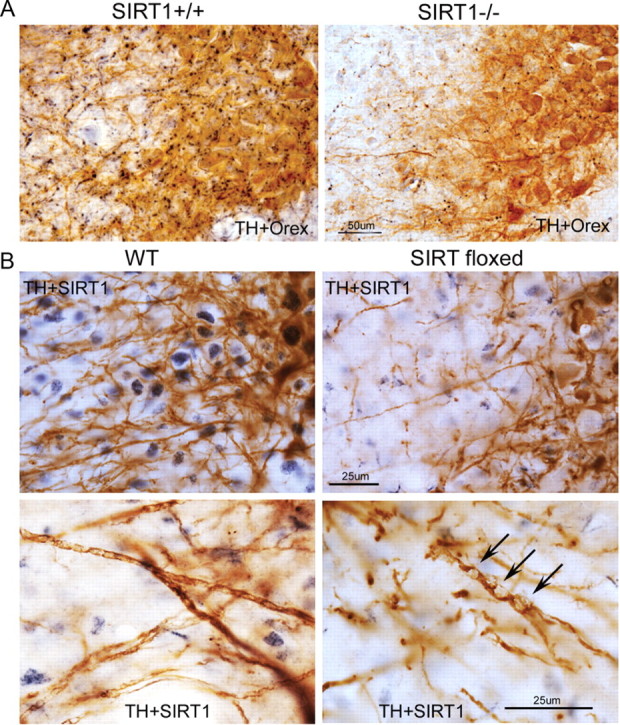
Effects on SIRT1 deficiency on wake neuron morphology. A, Orexinergic projections (nickel, black) into the region of LC dendrites (DAB, brown) in SIRT1+/+ and SIRT1−/− mice. Scale bar, 50 μm. B, LC dendrites in WT cre-injected and SIRT1 floxed cre-injected mice. Top, Locus ceruleus TH-labeled dendrites in WT cre-injected mouse (left) and SIRT1 floxed cre-injected mouse (right). Scale bar, 25 μm. Neuronal SIRT1 immunoreactivity (DAB, dark blue) in WT and scant glial labeling in SIRT floxed mouse. Bottom two panels show LC–TH dendrites in WT (left) and SIRT1 flox–cre mouse (right) with large vacuoles (arrows). Scale bar, 25 μm.