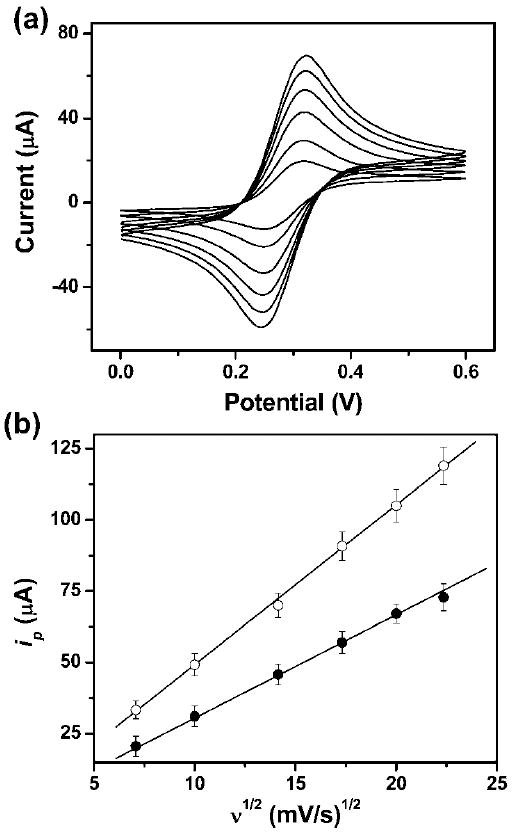
Fig. 2.

(a) Cyclic voltammograms of 2.0 mM ferrocene carboxylic acid in 0.5 M KCl aqueous solution (pH = 7.0) in a μPED at various scan rates (ascending along y-axis): 50, 100, 200, 300, 400, and 500 mV s−1. We used a 4 mm by 4 mm carbon-printed electrode as the working electrode, and a printed Ag/AgCl electrode as the reference electrode. (b) The plot of anodic peak current vs. the square root of the scan rate (ν1/2) for CV experiments conducted on a paper device (●) and in a bulk solution (○). The solid lines represent a linear fit to (●) with regression equation: y = −3.6 + 3.5x (R2 = 0.998, n = 8), and a linear fit to (○) with regression equation: y = −7.1 + 5.6x (R2 = 0.999, n = 8).
