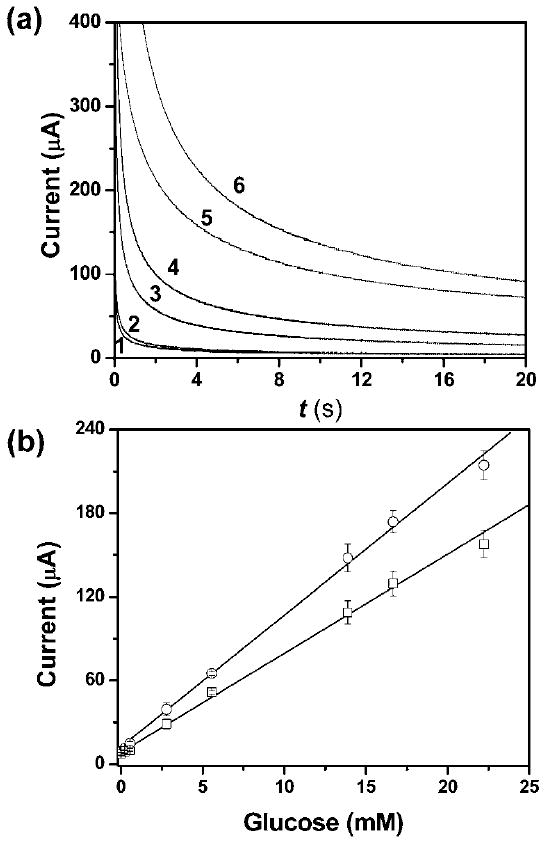
Fig. 3.

(a) Representative chronoamperometric curves for glucose concentrations (mM): 0 (1), 0.2 (2), 2.8 (3), 5.6 (4), 13.9 (5) and 22.2 (6) in the μPEDs. (b) Calibration plots of current as a function of the concentration of glucose for the detection of glucose in the μPEDs (□) and in bulk solutions (○). We used three carbon electrodes as working, counter, and pseudo-reference electrodes, respectively. The working electrodes had a surface area of 16 mm2 in contact with the solution in both the μPEDs and the bulk solutions. The distance between electrodes was 1.0 mm. A 500 mV step potential (vs. a carbon pseudo-reference electrode) was used to generate the calibration curve. The solid line represents a linear fit to (□) with regression equation: y = 9.5 + 6.9x (R2 = 0.995, n = 8), and a linear fit to (○) with regression equation: y = 12.1 + 9.4x (R2 = 0.997, n = 8).
