Fig. 5.

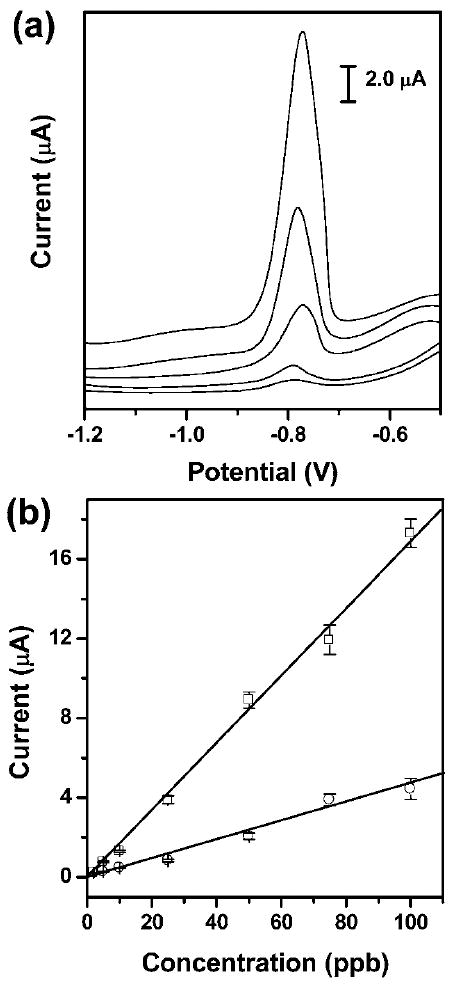
(a) Square-wave anodic stripping voltammograms for the analysis of trace Pb(ii) in 0.1 M acetate buffer (pH 4.5) in the presence of Zn(ii) (1: 1 molar ratio of Pb(ii) to Zn(ii)) in the μPEDs with a solution of analytes continuously wicking along the paper channel. The concentrations (ppb) of Pb(ii) (ascending along the y-axis) are 5, 10, 25, 50, and 100. The data are unsmoothed. (b) The resulting calibration plots for the analysis of trace Pb(ii): a 100 μL solution of analytes placed on the electrodes (○), and a solution of analytes continuously wicking along the paper channel in the μPEDs (□). Square-wave voltammetric stripping was performed in the potential range of −1.2 to −0.5 V under optimized conditions: frequency, 20 Hz; amplitude, 25 mV; potential increment, 5 mV; equilibration time, 30 s. Deposition was performed at −1.2 V for 120 s; ‘cleaning’ was performed at +0.5 V for 60 s. A bismuth(iii) concentration of 500 μg L−1 was chosen for the co-deposition of heavy-metal ions. We used screen-printed carbon electrodes as working and counter electrodes, and a screen-printed Ag/AgCl electrode as the reference. The solid lines represent a linear fit to (○) with regression equation: y = −0.08 + 0.05x (R2 = 0.978, n = 8), and a linear fit to (□) with regression equation: y = −0.21 + 0.17x (R2 = 0.996, n = 8).
