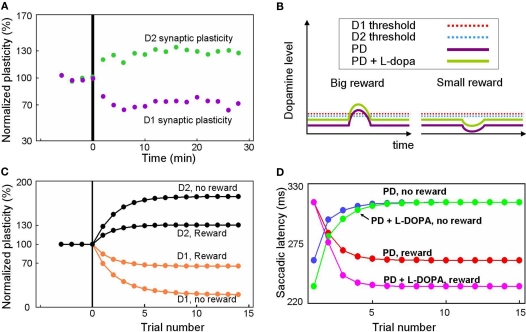
Figure 7.
Simulation of disrupted plasticity in Parkinson's disease (PD). (A) Disrupted plasticity in MSNs (green and purple dots) in a rat PD model. When input stimulation was followed by excitation of a MSN repeatedly, the response of the MSN to the input changed gradually, in the directions opposite to control subjects. Data are from Shen et al. (2008), adapted with permission. (B) Hypothesized changes in the DA level and D1/D2 thresholds in PD and PD with l-DOPA. See text for details. (C) Simulated plasticity in the direct pathway MSNs (D1) and the indirect pathway MSNs (D2) in PD subjects performing the 1DR task. The simulation shows disrupted plasticity in PD, which is similar to that shown in the rat PD model (A). Note that the magnitude of the plasticity is larger for no-reward trials than for reward trials. (D) Simulated saccade latency in PD subjects with no treatment (PD) and PD subjects with l-DOPA. See text for further explanations.

