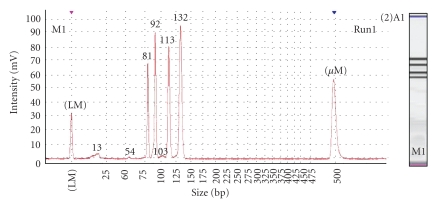
Figure 5.
Electropherogram and “gel-like” image of positive control on the Shimadzu MultiNA. The x-axis on the electropherogram represents amplicon size (bp), whist the y-axis represents the measurement response of fluorescence units. Amplicons of interest in order of size (bp) are lower marker, Zein (81), Lectin (92), CaMV (113) and combined CaMV 35s promoter/NOS terminator (132) amplicons, and the upper marker.

