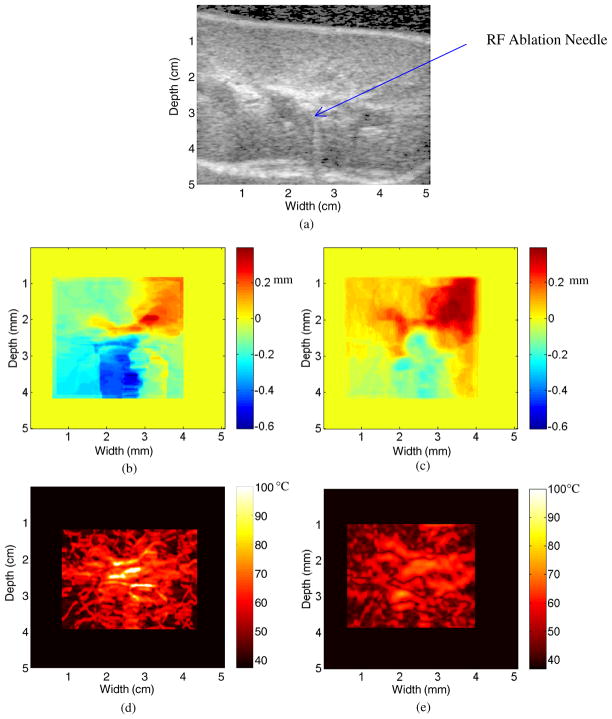
Figure 2.
B-mode image after 30 s of ablation (a), along with the displacement map during a porcine kidney ablation procedure using (b) 2D block matching and (c) multi-level 2D cross-correlation after 30 s of ablation. The corresponding temperature maps after 30 s of ablation using the two algorithms are shown in (d) and (e).

