
Figure 7.
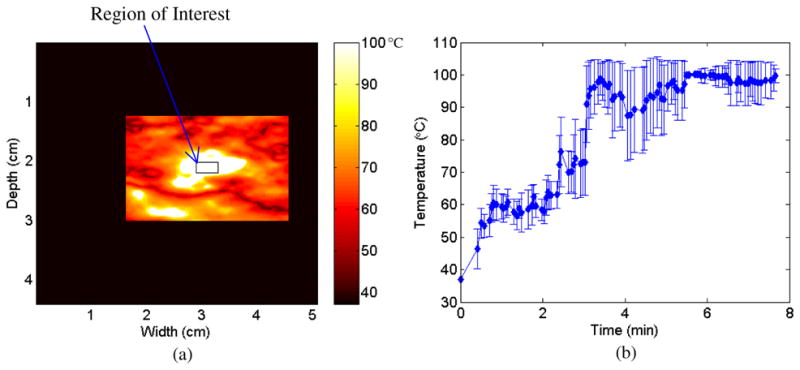
A region of interest (ROI) outlined on a temperature map in (a) along with the estimated temperature versus time graph with error bars (b) obtained for the ROI over the duration of the ablation procedure.
Official websites use .gov
A
.gov website belongs to an official
government organization in the United States.
Secure .gov websites use HTTPS
A lock (
) or https:// means you've safely
connected to the .gov website. Share sensitive
information only on official, secure websites.
A region of interest (ROI) outlined on a temperature map in (a) along with the estimated temperature versus time graph with error bars (b) obtained for the ROI over the duration of the ablation procedure.