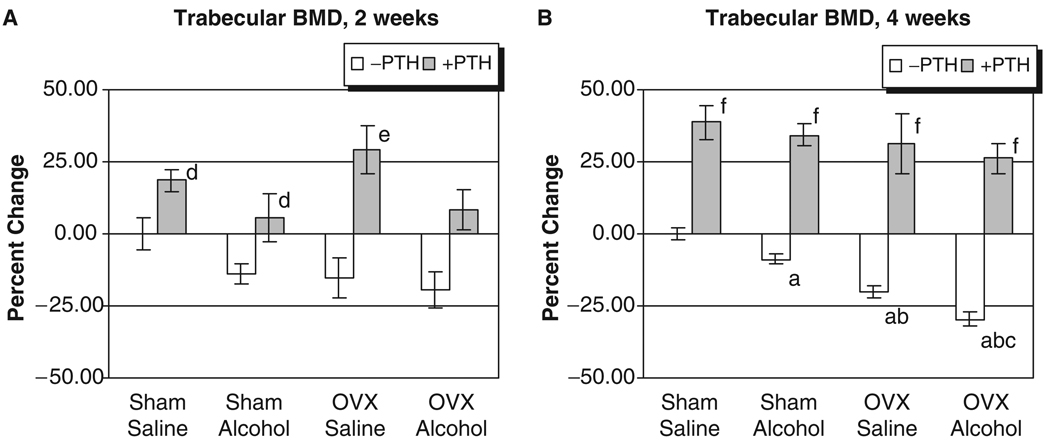
Fig. 1.
Rat vertebral trabecular bone mineral density analysis. (A) Two weeks of treatment. (B) Four weeks of treatment: ap<0.05 compared with sham–saline group; bp<0.05 compared with sham alcohol group; cp<0.05 compared with ovriectomized–saline group, 1-way ANOVA and Tukey’s multiple comparison procedure; dp<0.05; ep<0.01; fp<0.001 compared with its respective non-PTH group, Student’s t test.

