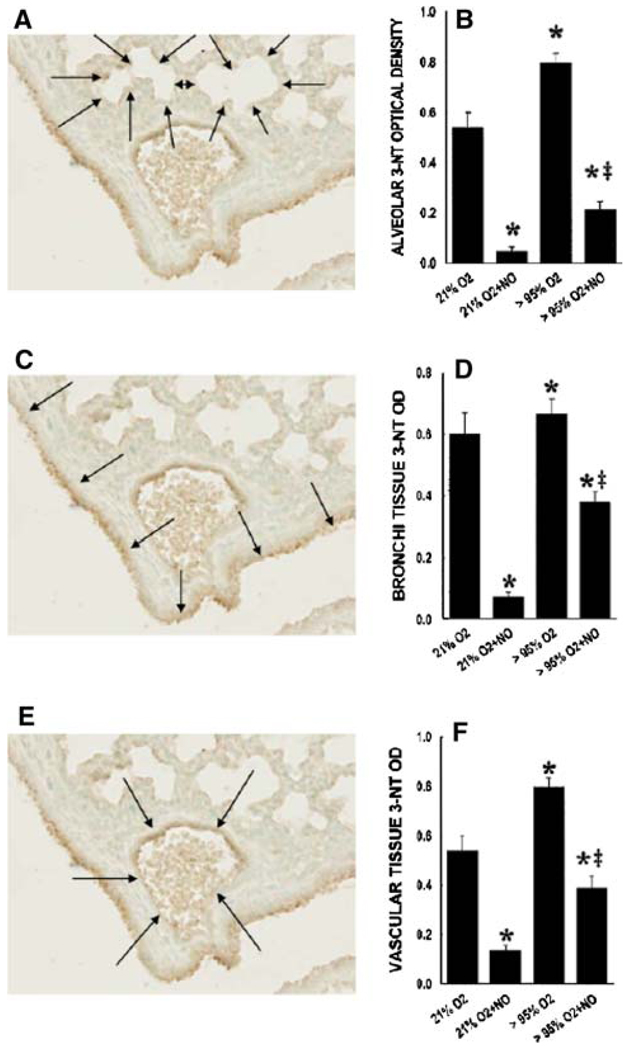
Fig. 4.
Effect of hyperoxia ± NO on 3-NT immunolabeling for alveolar, bronchial, and vascular lung sections. Optical density of 3-nitrotyrosine staining from lung tissue of mouse pups exposed to 21% O2, 21% O2 + 10 ppm NO, >95% O2, and >95% O2 + 10 ppm NO for specific areas of the lung tissue. a, c, e Representative lung section demonstrating how the lung sections were divided into alveolar (a), bronchial (c), and vascular (e) sections. b, d, f Data from all of the lungs studied. * Different from 21% O2, p < 0.01. ‡ 95% O2 + 10 ppm NO different from 95% O2 alone, p < 0.05

