
FIGURE 1. RCC risk by occupational cumulative exposure to PAHs and Plastics.
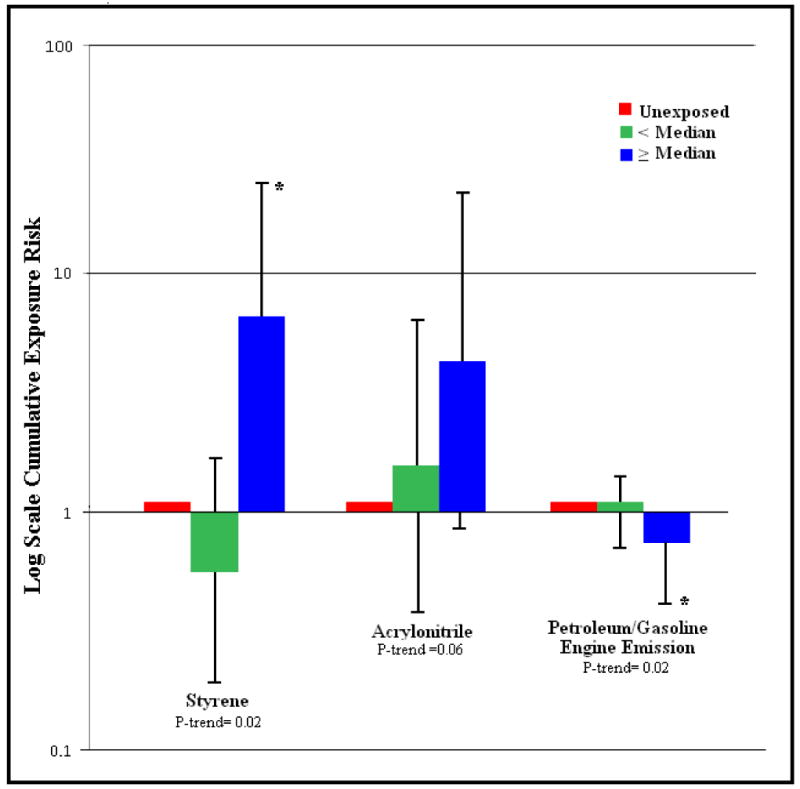
Renal cell carcinomas risk by occupational cumulative exposure to polycyclic aromatic hydrocarbons and plastics cumulative exposure for (A) styrene (exposure below the median: OR = 0.6, 95% CI = 0.2--1.7; exposure at or above the median: OR = 6.7, 95% CI = 1.8--24.3; P-trend = 0.02), (B) acrylonitrile (exposure below the median: OR = 1.6, 95% CI = 0.4--6.4; exposure at or above the median: OR = 4.3, 95% CI = 0.9--22.1; P-trend = 0.06), and C) petroleum/gasoline engine emissions (exposure below the median: OR = 1.0, 95% CI = 0.7--1.4; exposure at or above the median: OR = 0.6, 95% CI = 0.4--0.9; P-trend = 0.02).
* P-value <0.05