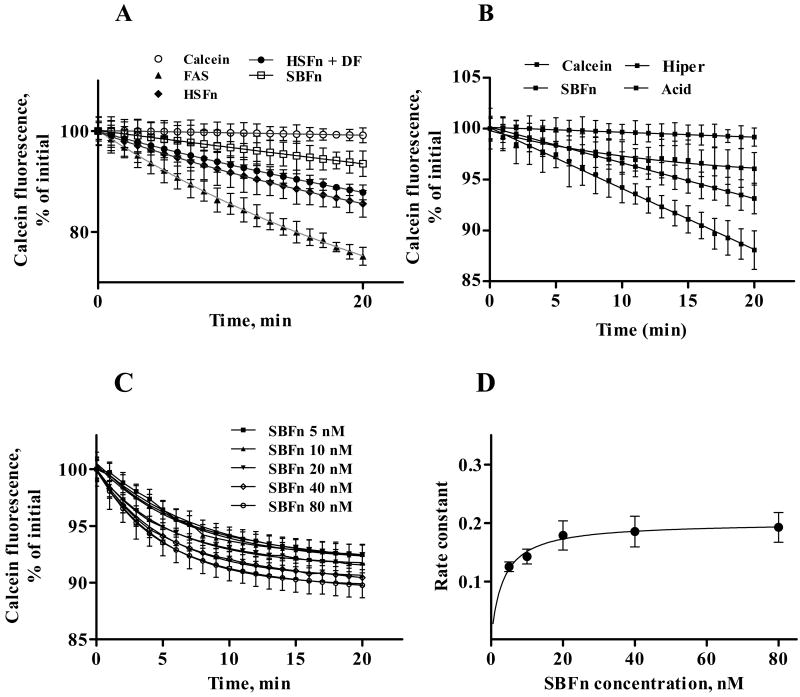
Figure 4. Incorporation of SBFn iron into the LIP.
A: entry of exogenous iron into polarized calcein-loaded Caco-2 cells was measured as the quenching of calcein fluorescence. Fluorescence was monitored every 1 min for 20 min. Iron-donating capacity of 10 μmol/L FAS (ferrous ammonium sulfate), 10 nmol/L HSFn (horse spleen ferritin), 10 nmol/L HSFn with 10 μmol/L DF (given simultaneously), and 10 nmol/L SBFn was determined. Calcein photobleaching during the experiment, determined in parallel using cells with calcein but no added iron, was less than 2% of the initial fluorescence after 20 min of incubation. B: Iron-donating capacity of 10 nmol/L SBFn in DMEM (SBFn), DMEM + 10 mmol/L acetic acid, pH 5.0 (Acid) or DMEM + 0.45 mol/L sucrose (Hiper). C: Calcein-loaded Caco-2 cells were incubated for the stated times with SBFn in the 5-80 nM range, and iron incorporation into the labile iron pool was detected by the quenching of intracellular calcein. Curves were adjusted with a single exponential decay function using the GraphPad 5.0 program. D: the rate constants derived form curves in Figure 2B were plotted as a function of SBFn concentration. An apparent KD = 3.29 ± 0.51 nM was obtained. Data points represent Mean ± SEM of triplicates. Shown are representative experiments (N = 3).

