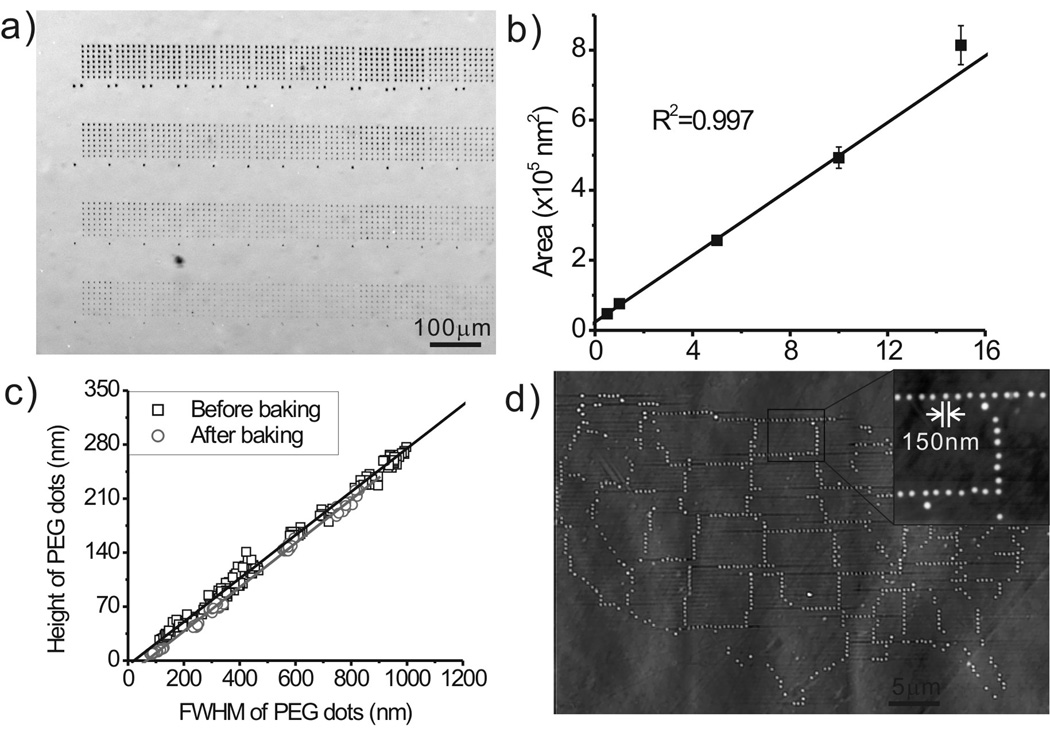
Figure 1.
(a) An optical microscope image of PEG patterns generated by DPN with different contact time. Each row was generated by 12 individual pens simultaneously. (b) A plot of the PEG diffusion rate. (c) The height of PEG dots as a function of their FWHM. (d) An AFM topography image of a United States mainland map consisting of ~2,000 PEG nanodots. The inset is a zoom-in image showing that the size of each PEG nanodot is about 150 nm.

