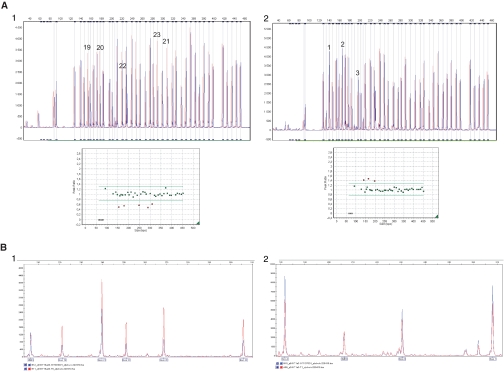
Figure 2.
MLPA and QMPSF electropherograms for SLC12A3 from two patients. For MLPA, each peak represents one exon of the SLC12A3 gene and 13 control probes. For QMPSF, each peak represents one analyzed exon and the HMBS internal control. Control samples are shown in red and patients' samples in blue. (A1) The MLPA half doses for exons 19 to 23 in patient GT004 and peak height ratio showing the deleted exons with ratio <0.7. (A2) MLPA duplication of exons 1 to 3 in patient GT137 and peak height ratio showing the duplicated exons with ratio >1.3. (B1) QMPSF half doses for exons 19 to 23 in patient GT004. (B2) QMPSF duplication of exons 1 to 3 in patient GT137.

