Figure 5.
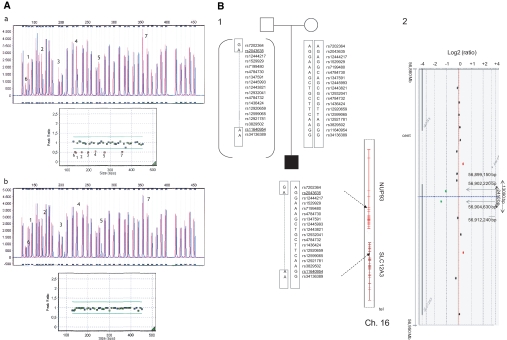
Characterization of SLC12A3 E1_E7del for patient BT213. (A) MLPA electropherograms for the proband and his mother. Each peak represents one exon of the SLC12A3A gene and 13 control probes. (Aa) The electropherogram of the proband shows abnormal height peaks (in blue) in seven exons (numbered) compared with a normal control (in red). The peak ratio graph shows the 7 deleted exons for which the ratio was <0.7. (Ab) The electropherogram of the mother showing normal height peaks for all of the exons (blue) compared with a normal control (red). Normal peak ratios revealed an equivalent number of copies. (B1) Pedigree showing the constructed haplotypes resulting from biallelic SNP genotyping. The proband is shown in black. The SNPs covering the approximately 16-kb region upstream from the SLC12A3 gene are shown, including the two SNPs mapped to intron 8 of the SLC12A3 gene. The two deletion-flanking SNPs, covering a region of 89.9 kb, are underlined. Chromosome 16 showing both SLC12A3 and NUP93 (on the right). Cen, centromere; Tel, telomere. (B2) Results of molecular karyotyping. Array-comparative genomic hybridization log 2 ratio plot of chromosome 16 of the proband from the Agilent 244k, showing a 13-kb deletion from the probe lying within the 5′UTR of the SLC12A3 gene (56,899,150 Mb; hg19) to the probe that is specific to exon 9 (56,912,240 Mb; hg19). The deleted probes are in green, and unaltered probes (gain or loss) are in black.

