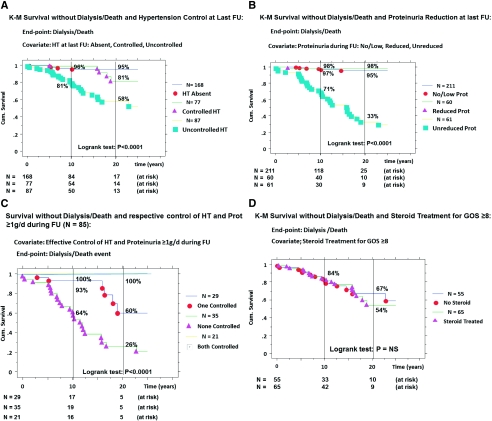
Figure 3.
Kaplan-Meier survival curves without D/D according to: the control of hypertension (absence, controlled, and uncontrolled) (A), the reduction of proteinuria ≥1 g/d (low/absent, reduced, and unreduced) (B), the control of both HT and proteinuria (both, none, and only one controlled) (C), and steroid treatment for severe renal lesions (no or yes) at last follow-up (D); D/D (primary event); comparison of curves by the log-rank test; cumulative incidence of event = (1 − survival).

