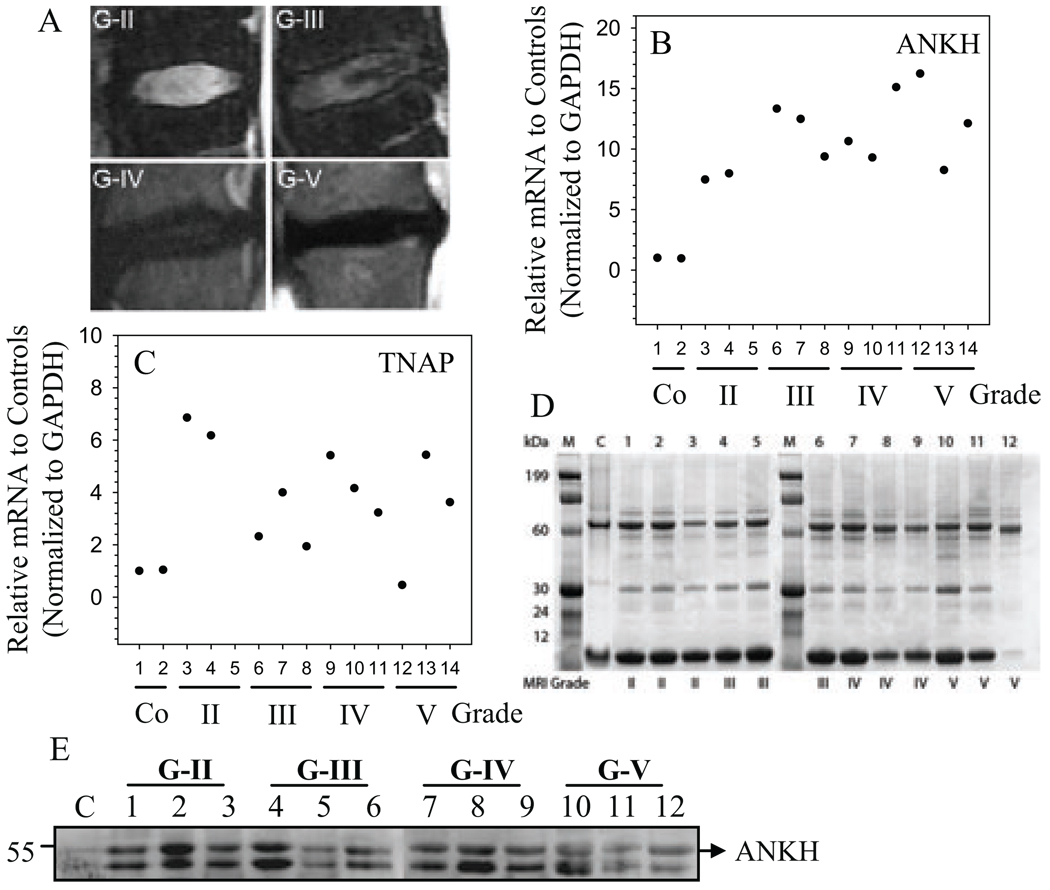
Figure 6.
Expression of ANK in human degenerate NP. A. Representative MRI images of patients with degenerative disc disease. (From the top left, clockwise: Grade II,III,IV,V) B and C. Real time RT-PCR analysis of ANK (B) and TNAP (C) mRNA expression in multiple human NP tissue samples. Samples from three different patients were used for each degenerative grade. With increased severity of disc degeneration there is a relative increase in the expression of ANK and TNAP mRNA. Mean expression of normal controls (c) was set at 1.0. C. Human NP protein extracts were subjected to SDS gel electrophoreses and stained with coomasie blue. The distinct bands in each sample verifies the quality of the protein samples. D. Western blot analysis of ANK expression in human degenerate NP samples. ANK expression is increased in all the degenerate samples compared to control.

