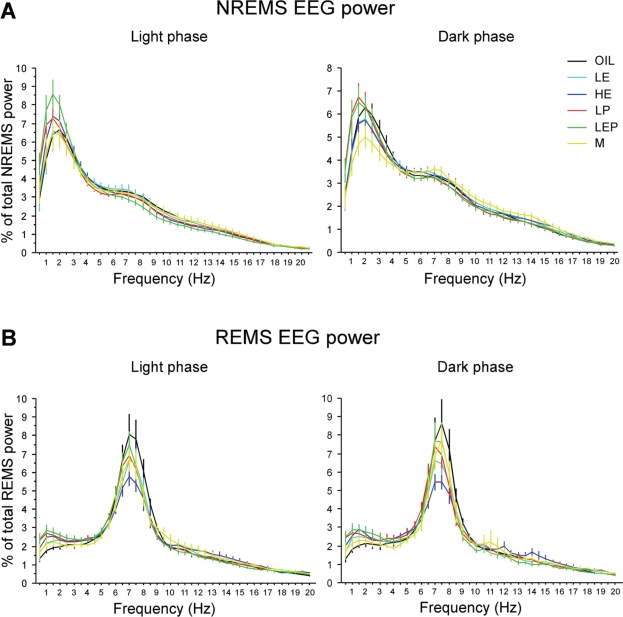
Figure 5.
Power spectra of the EEG during NREMS (A) and REMS (B) in the baseline light (left) and dark (right) phases in the Oil, LE, HE, LP, LEP, and M groups. EEG power was normalized to the total power (0.5-50 Hz) for each 0.5 Hz bin in each animal. The power spectra during NREMS and REMS in the light and dark phases were similar among groups, except for a trend toward lower REMS theta power in the HE group. Data are shown as means ± SEM of 8 animals per group.

