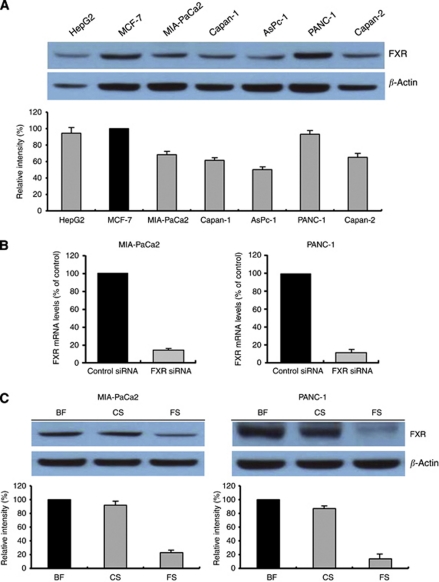
Figure 2.
Farnesoid X receptor expression in pancreatic cancer cell lines. BF, basal FXR; CS, control siRNA; FS, FXR siRNA. (A) Western blot analysis of FXR was carried out on 50 μg of total proteins extracted from five pancreatic cancer cell lines; HepG2 and MCF-7 cells seen as a band at ∼56 kDa; HepG2 and MCF-7 were used as positive controls. β-Actin was used as a loading control. (B, C) MIA-PaCa2 and PANC-1 cells were transfected with control siRNA or FXR siRNA for 72 h. (B) Total RNA was extracted and analysed by TaqMan real-time quantitative RT–PCR. Farnesoid X receptor mRNA values were normalised to GAPDH mRNA. (C) Total proteins were extracted and western blotting analysis was performed. β-Actin was used as a loading control. Band intensities were evaluated in terms of relative density and expressed as percentages of the control, which was assumed to be 100%. Columns, mean of three independent experiments; bars, s.e.m.

