Figure 6.
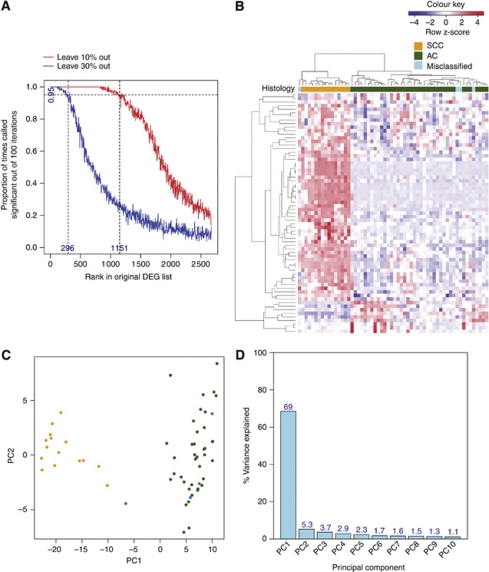
A refined gene signature accurately partitions the NSCLC samples into histological subtypes. (A) Proportion of times the 2673 differentially expressed probesets appear as significant in 100 jackknifed data sets (with 10% and 30% of the samples removed) against rank in the original data set. (B) Hierarchical clustering of the 296 stable probesets on the 58 NSCLC samples. Genes and samples were clustered based on Pearson's correlation. The scaled expression of each probeset, denoted as the row Z-score, is plotted in red–blue colour scale with red indicating high expression and blue indicating low expression. The coloured bar above the heatmap indicates the histological classification: orange=SCC; green=AC; blue=misclassified samples. (C) Principal component analysis of the 296 stable probesets when applied to the NSCLC data set. The numbers represent the patient IDs. Different colours are used to represent the different histological subtypes: orange=SCC; green=AC; blue=misclassified samples. (D) Percentage variance explained by the first 10 principal components.

