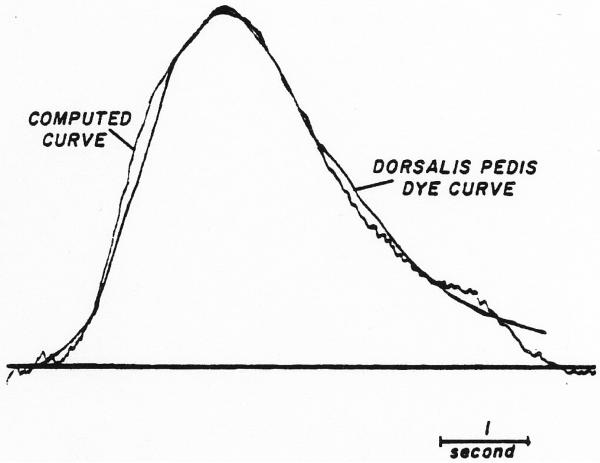
Fig. 14.
Computation of dispersing process occurring between the femoral artery and dorsalis pedis artery. Original curves were recorded following aortic injection of indocyanine green. The recorded femoral curve (not shown) was used as input and convoluted with an assumed dispersing process to produce a theoretical output curve. The parameters of the mode Ifor the dispersing process were adjusted until the output curve approximated the curve recorded at the dorsalis pedis artery lagged by a single exponential (τ = 0.5 sec.) to compensate for the difference between sampling systems. The final values (σ = 0.3 sec., τ = 0.9 sec., tc = 4.3 sec.) provides a description of dispersion between the two sampling points. The ordinate scale is linear; Cp = 20.0 mg./l.

