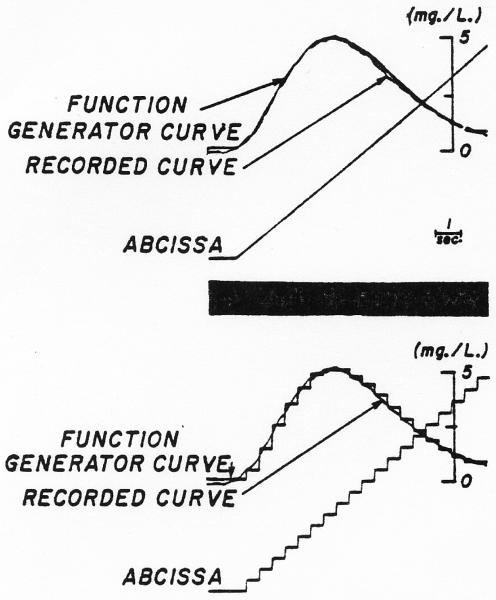
Fig. 4.
Simulation of a dye dilution curve in the function generator. Upper panel: With a ramp as the x-axis voltage, the dye curve was approximated by 10 straight lines and the junctions smoothed. Lower panel: With the same settings of the function generator as determined for the upper panel, the ramp was replaced by the staircase illustrated so that the histogram approximated the dye curve.

