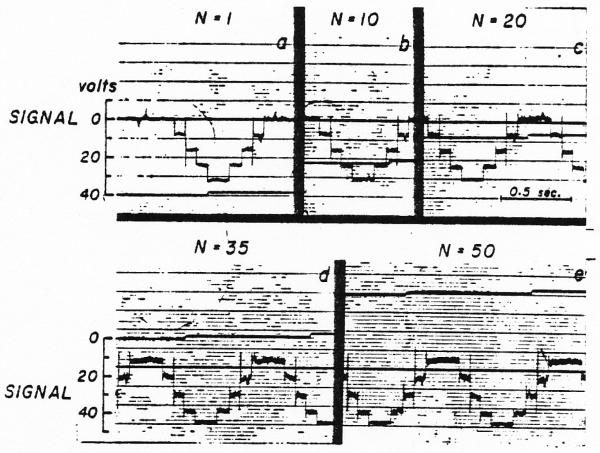
Fig. 5.
Test of the tape loop summation method. a. Curve recorded on the tape loop after one passage from the tape through the reproduce amplifier of the tape system, the summing amplifier (ampl. 5 of Fig. 3), and the record amplifier of the tape, b, c, d, and e. Records of the same curve after 10, 20, 35 and 50 passes through the same amplifiers. The noise is markedly increased but the gain in amplitude is slight (increased from 32 to 34 volt). The persistence of the sharp spikes attests to the high-frequency response of the system.

