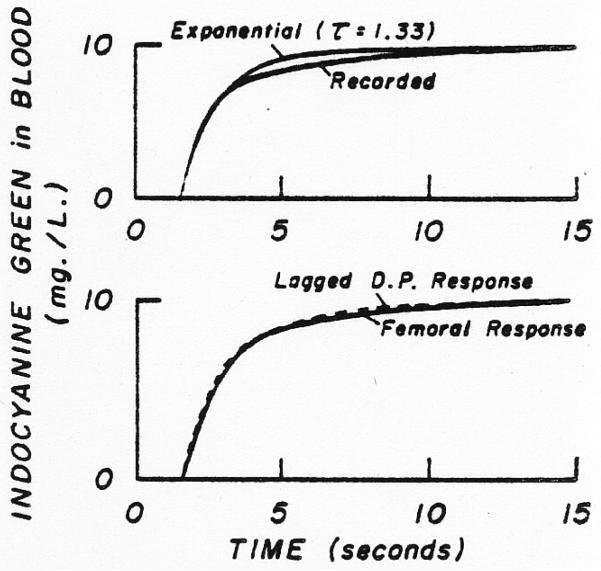
Fig. 8.
Response of the sampling system to a step change in dye concentration at the tip of the catheter. Upper panel. The actual response recorded following the sudden change from blood containing no dye to that containing lOmg./L. indocyanine green is only moderately well approximated by an exponential rise (τ = 1.33 sec.) beginning after 1.55 sec. Lower panel. The response of the sampling system at the dorsalis pedis artery (D.P.) is lagged by a single exponential (τ = 0.59 sec.) to approximate the response obtained through the femoral artery sampling system (see Fig. 2). In addition, the dorsalis pedis response is delayed 0.2 sec. to account for the difference between the appearance times.

