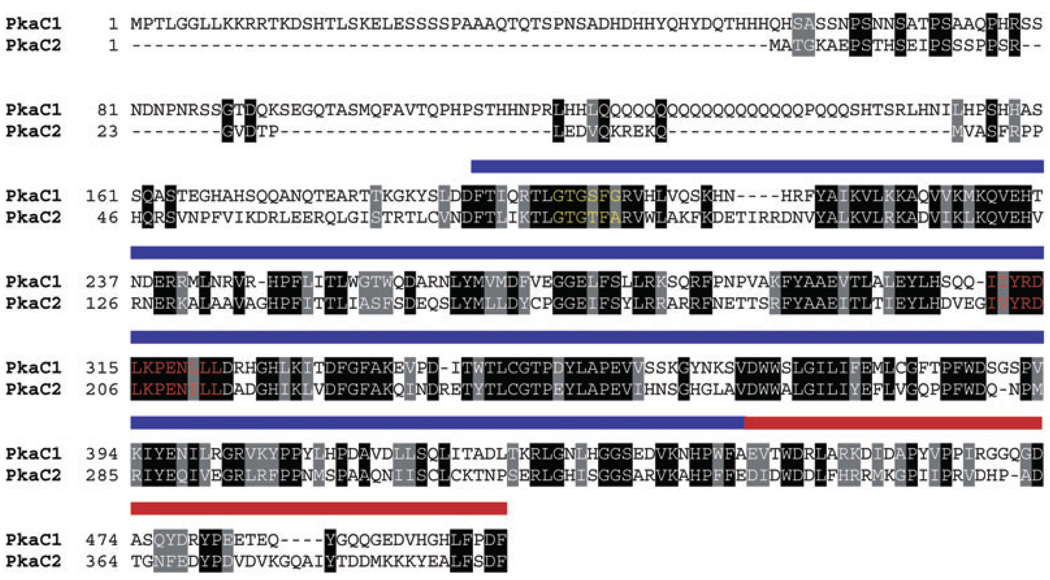
Fig. 1. Sequence analysis of PkaC1 versus PkaC2.
The protein sequences of PkaC1 and PkaC2 were aligned using DNAMAN software (Lynnon Corp. Canada) using default parameters and shaded using BOXSHADE 3.21. The blue and red bars span the conserved serine/threonine kinase domain and the conserved AGC domain respectively. The catalytic active site is highlighted in red font and the ATP-binding loop is highlighted in yellow font.

