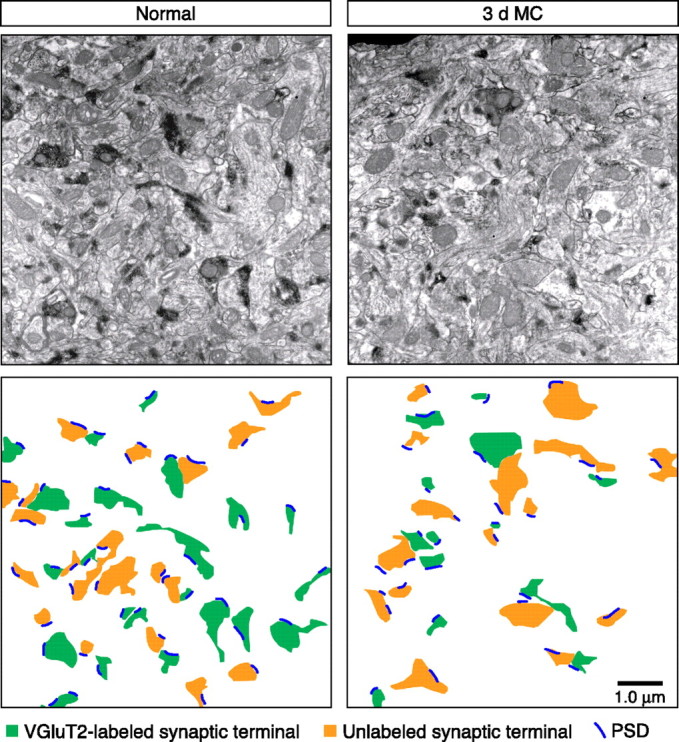
Figure 4.

VGluT2-labeled synaptic terminal density after 3 d MC. Example low-magnification EM micrographs from a control (normal) and 3 d MC case. The diagram below each image highlights identified synaptic terminals and PSDs in each case. Note the reduction in both the number and size of VGluT2-labeled terminals in the 3 d MC case.
