Figure 7.

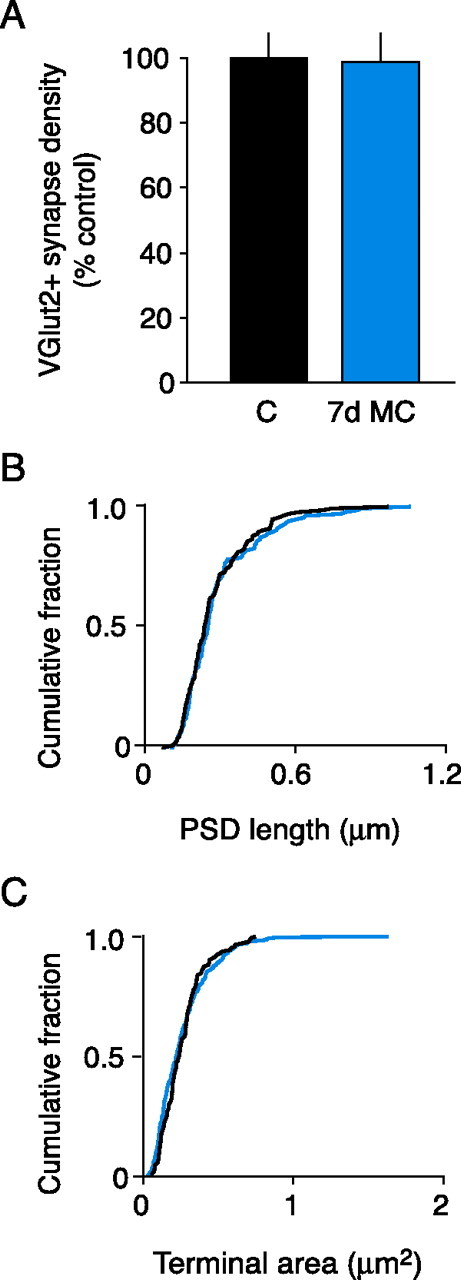
The effect of 7 d MC on VGluT2-labeled synapse density and morphology. A, Summary of VGluT2+ synaptic density (mean ± SEM). B, C, Cumulative probability histograms of PSD lengths (B) and VGluT2-positive terminal size (C) (black, control; blue, MC). The distributions of PSD lengths and synaptic terminal sizes were not significantly different between 7 d MC and control animals (p > 0.05, K-S test).
