
Figure 6.
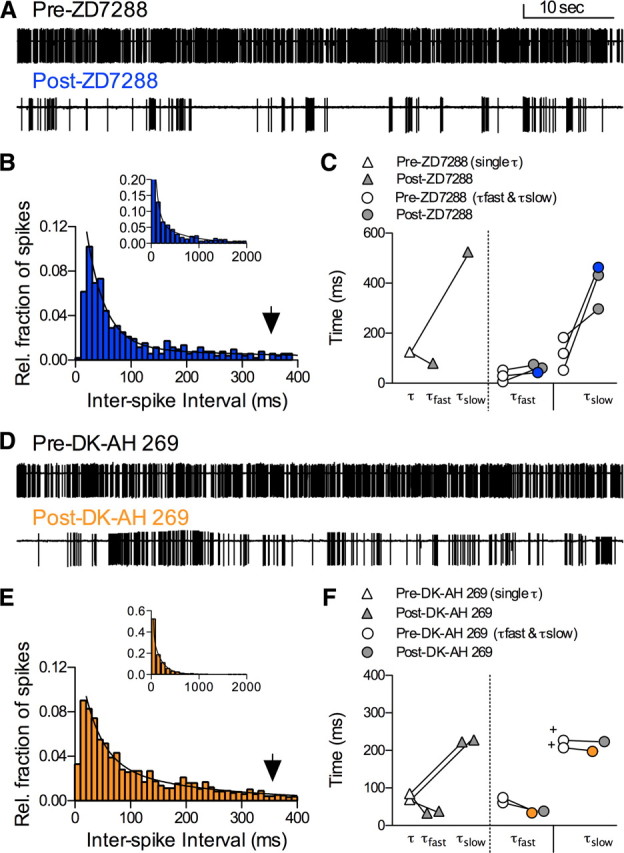
Spontaneous activity was markedly reduced by Ih antagonists. A, Top, Single 60 s trace of spontaneous activity before drug (mean ISI = 62 ms; 967 spikes; vertical calibration: 40 pA). Bottom, Single 60 s trace of spontaneous activity 300 s after application of 1 mm ZD7288 to the same recording above (mean ISI = 344 ms; 178 spikes). B, ISI histogram from 400 s of activity (mean ISI = 805 ms; 519 spikes) in 1 mm ZD7288 best fit by a two-phase exponential decay (τfast = 33 ms; τslow = 409 ms; %τfast = 94). Inset, ISI histogram of same data with 100 ms bins. C, Comparison of time constants from a pre-ZD7288 histogram best fit by a single-phase exponential (white diamond) compared to post-ZD7288 (gray diamonds) best fit by two-phase exponentials (n = 1). Circles represent pre- and post-ZD7288 histograms best fit by two-phase exponentials (white and gray, respectively; data from B in blue; n = 3). D, Top, Single 60 s trace of spontaneous activity pre-drug (mean ISI = 77 ms; 830 spikes; vertical calibration: 20 pA). Bottom, Sixty-second trace of spontaneous activity 300 s after application of 1 mm DK-AH 269 (mean ISI = 192 ms; 316 spikes). E, ISI histogram from 400 s of activity (mean ISI = 805 ms; 519 spikes) in 1 mm DK-AH 269 best fit by a two-phase exponential decay (τfast = 34 ms; τslow = 197 ms; %τfast = 75). Inset, ISI histogram with 100 ms bins. F, Comparison of time constants from pre-DK-AH 269 histograms fit by single-phase exponentials (white diamonds) and post-DK-AH 269 best fit by two-phase exponentials (gray diamonds; n = 2). Circles represent pre- and post-DK-AH 269 histograms best fit by two-phase exponentials (white and gray, respectively; data from E in orange; n = 2). Plus symbols indicate two pre-DK-AH 269 recordings that had apparently large τslow but with weights of 3 and 7%τslow, compared to the same recording post-DK-AH 269, which now had weights of 17 and 25%τslow.