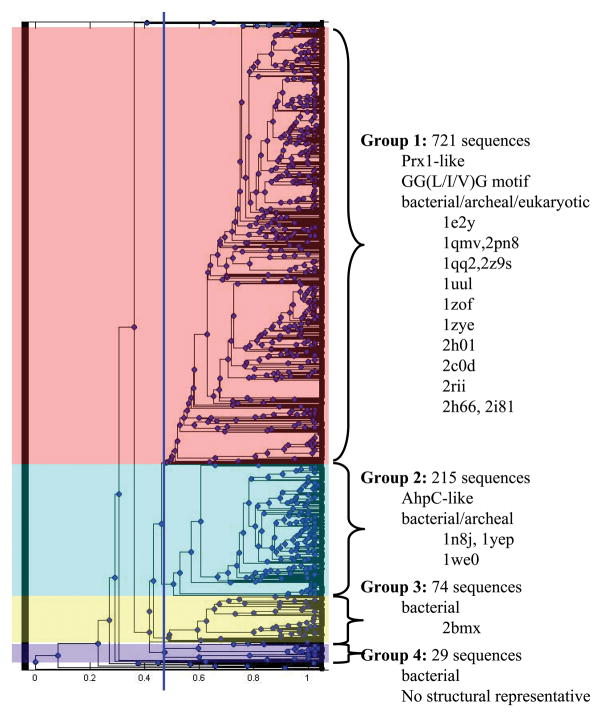
Figure 5. The AhpC/Prx1 subfamily can be subdivided into four distinct groups.
The functional site signatures obtained from the GenBank(nr) search for AhpC/Prx1 subfamily members were hierarchically clustered in Matlab. The dendrogram shown illustrates the resulting organization of functional site signatures and does not imply any evolutionary relationship. A cluster cutoff was identified (blue line in the dendrogram) and the subfamily was subdivided into four groups. Characteristics and structural representatives for each group are listed to the right.

