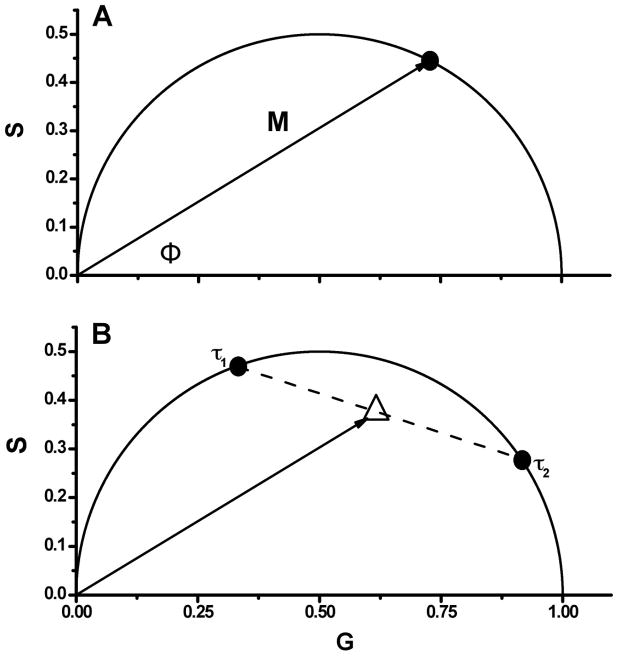
Figure 1.
A. Schematic illustration of the basic concepts of phasor plots. B. Two different fluorophores with lifetimes of τ1 and τ2, where τ1> τ2, and their hypothetical mixtures. Dashed line represents set of mixtures. Solid line illustrates vector M with phase shift Φ, which corresponds to the mixture, where the ratio of the fluorescence contributions between both fluorophores is 1:1. Note that increased fluorescence contribution from the fluorophore with fluorescence lifetime τ1 results in an increased angle Φ, decreased modulation M, and moves the phasor point closer to that of τ1.

