Fig. 3.
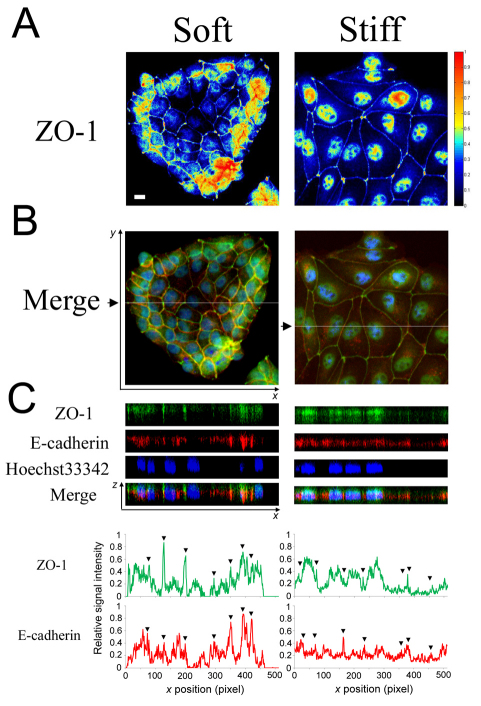
Matrix stiffness affects the molecular organization of adhesion structures at cell–cell contacts. MDCK cells cultured on soft (7 kPa) and stiff (31 kPa) substrata were serum starved and immunostained for ZO-1 (green) and E-cadherin (red). Nuclei were co-stained with Hoechst 33342 (blue). (A) Heat maps show the relative abundance of ZO-1 in the epithelial clusters integrated across the z-stacks. (B) Merged x-y images (top) were generated by averaging the pixel intensity across the z-stacks. White lines in the merged image (black arrows) indicate the planes for which x-z views (C) were generated. Scale bar: 10 μm. The line graphs show the quantification of relative intensity of ZO-1 and E-cadherin staining along the x-axis at a fixed y-axis position indicated by the white lines in B. Arrowheads indicate the location of cell–cell contacts.

