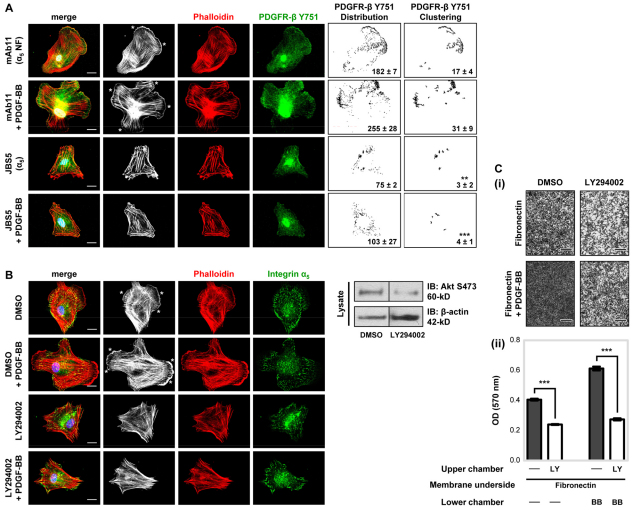
Fig. 8.
PI3K mediates PDGFR-β-induced actin arrangement and migration. (A) The cellular distribution of F-actin and phosphorylated PDGFR-β Y751 was examined by immunofluorescence microscopy. MSCs in serum-free conditions treated with 10 μg/ml anti-integrin α5 inhibitory antibody (JBS5) or non-functional (NF) anti-α5-integrin antibody (mAb11), as a control, were plated onto 10 μg/ml immobilised fibronectin in the absence or presence of 50 ng/ml PDGF-BB for 90 minutes at 37°C, before fixation with paraformaldehyde. Representative examples of MSCs double-labelled for phalloidin (white and red) and Y751 phosphorylated PDGFR-β (green), and merged images are shown. Nuclei appear blue owing to DAPI staining. F-actin membrane ruffling is highlighted by a white asterisk. To quantify receptor distribution and clustering (Chen et al., 2010), images were analysed using the ImageJ ‘analyse particles’ function (as described in the Materials and Methods). Corresponding particle analysis images of PDGFR-β distribution (1–500 pixels) or PDGFR-β clustering (10–500 pixels) are shown next to each original image. The mean number of particles (±s.d.) derived from five different single-cell images is denoted in black (**P<0.01; ***P<0.001 compared with the fibronectin-induced PDGFR-β clustering in the absence of JBS5). Images are representative of at least three independent experiments. Scale bar: 20 μm. (B) The cellular distribution of F-actin and integrin subunit α5 was examined by immunofluorescence microscopy. MSCs in serum-free conditions treated with 20 μM LY294002, or DMSO as a control, were plated onto 10 μg/ml immobilised fibronectin in the absence or presence of 50 ng/ml PDGF-BB for 90 minutes at 37°C, before fixation with paraformaldehyde. Representative examples of MSCs double-labelled for phalloidin (white and red) and integrin α5 (green), and merged images are shown. Nuclei appear blue after DAPI staining. F-actin membrane ruffling is highlighted by white asterisks. Images are representative of at least three independent experiments. Scale bar: 20 μm. Inhibition efficiency of LY294002 on Akt phosphorylation by immunoblotting is shown to the right of the image panel. (C) The involvement of PI3K in MSC migration towards fibronectin was evaluated using a Boyden chamber migration assay. MSCs in serum-free conditions in the upper chamber treated with 20 μM LY294002 (LY) or DMSO (−), as a control, were cultured for 4 hours at 37°C in Boyden chambers pre-coated on the underside with 10 μg/ml fibronectin, with or without 50 ng/ml PDGF-BB in the lower chamber. (i) Images are representative of the migratory cells per field on the membrane underside of three independent experiments. Scale bar: 400 μm. (ii) Data are represented as mean (±s.d.) optical density (OD 570 nm) of stained migratory cells of two readings of an individual experiment, repeated three times. Conditions are compared against their respective MSC migration in the absence or presence of PDGF-BB (***P<0.001 by one-way ANOVA).

