Figure 2.

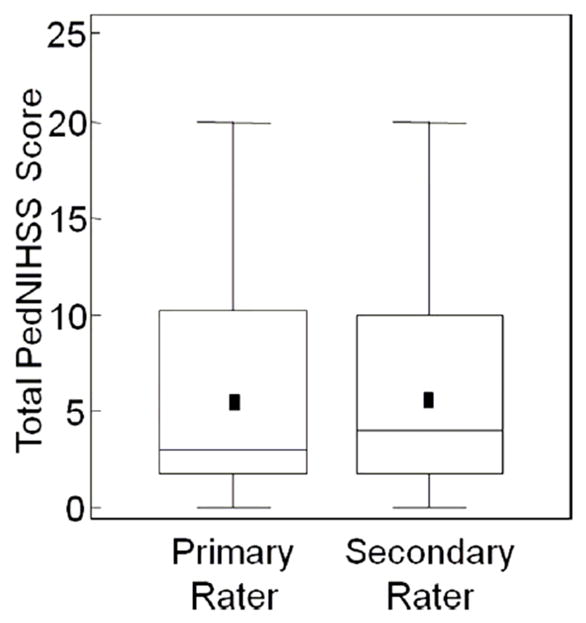
Box plot demonstrating total PedNIHSS scores of each rater: Mean (symbol), lower line of box = 25%ile, upper line of box = 75%ile, line in box = median, upper and lower whiskers = largest and smallest non-outlying values, respectively.

Box plot demonstrating total PedNIHSS scores of each rater: Mean (symbol), lower line of box = 25%ile, upper line of box = 75%ile, line in box = median, upper and lower whiskers = largest and smallest non-outlying values, respectively.