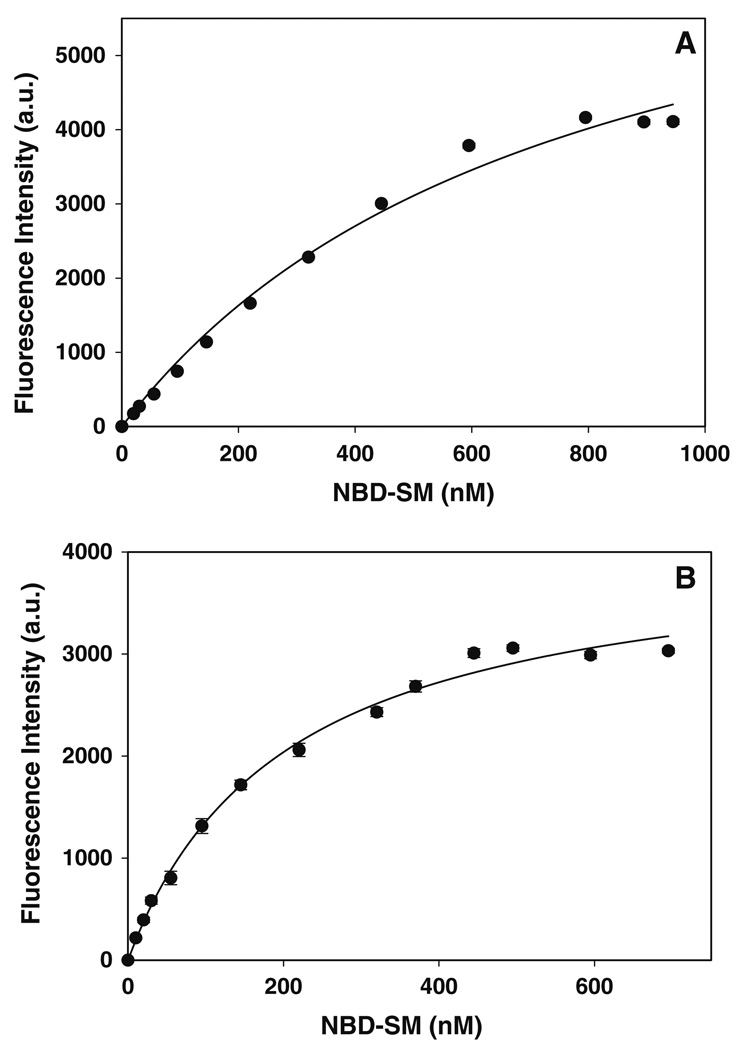
Fig. 6.
Titration of plasma membrane and lipid droplet fractions with NBD-sphingomyelin. The titration of plasma membranes (a) and lipid droplet (b) fractions with NBD-sphingomyelin was followed by an increase in fluorescence intensity as described in the “Materials and Methods” section. The fluorescent intensity data, representing the mean ± SE of three independent measurements, were analyzed to determine the dissociation constant Kd and binding capacity Bmax

