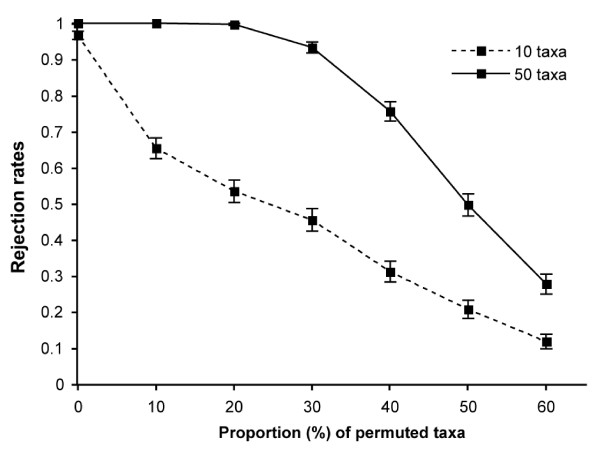
Figure 1.
Rejection rates of H0 for the global CADM test, comparing data sets simulated on partly similar trees, with identical evolutionary parameters (GTR+ Γ+ I). Three partially congruent matrices (CMP) and two incongruent matrices (IM) were included in each test, for a total of five distance matrices (M = 5). CMP were generated by permuting an increasing number of taxa from a total of 10 taxa (dashed line) and 50 taxa (solid line), which corresponds to different level of congruence, and for L = 10 000 bp. Rejection rates are given at a significance level of 0.05, with 95% confidence intervals represented by vertical lines, calculated from 1000 replicates.

