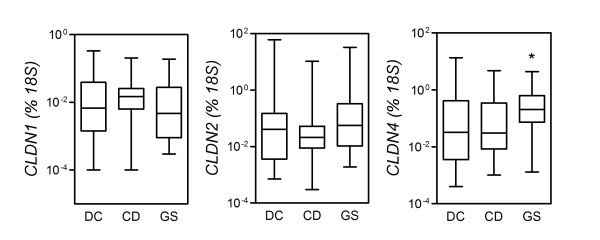
Figure 2.
The relative expression of tight junction (TJ)-related genes in the mucosa of gluten-sensitive patients (GS) versus celiac disease patients (CD). Expression of the indicated genes encoding for components of the TJ complex was measured by quantitative polymerase chain reaction assay of RNA extracted from small intestinal bioptic specimens (see Methods). Boxes represent the median (interquartile ratio), and whiskers represent the range of relative RNA levels, expressed as a percentage of an 18S housekeeping gene in 24 GS patients, 31 CD patients and 24 dyspeptic controls. *P < 0.05 relative to CD (Mann-Whitney U test).

