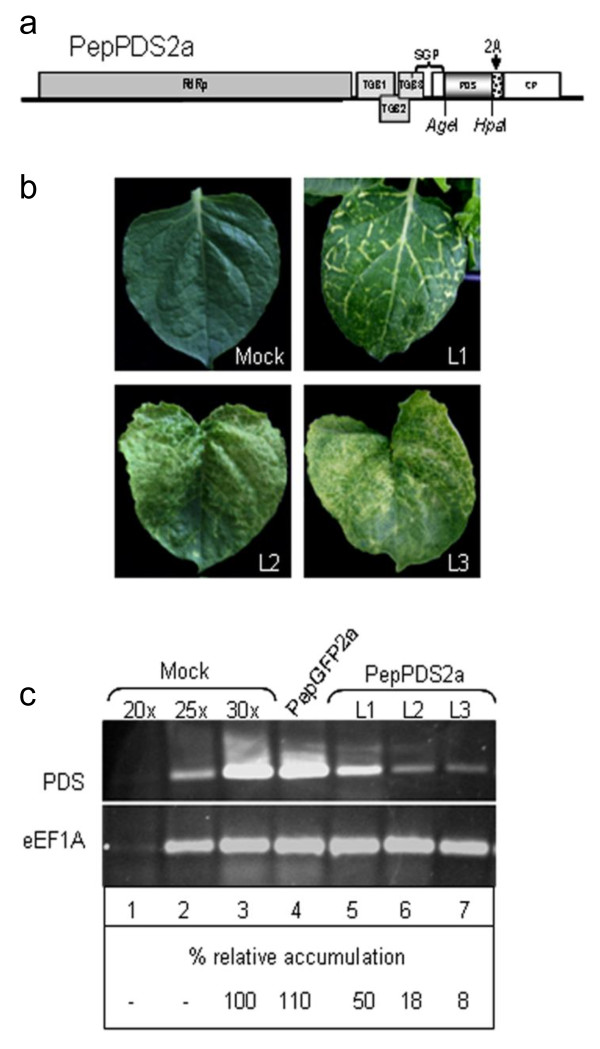
Figure 7.
PepMV based gene silencing vector. (a) Schematic representation of PepPDS2a. (b) Representative leaves from N. benthamiana plants infected with the PepPDS2a vector showing different phenotypes of photobleaching (L1, L2 and L3). (c) Quantification of pds mRNA levels by semi-quantitative RT-PCR in plants inoculated with water (mock), pBPepGFP2a and pBPepPDS2a, as indicated. Lanes 1-3 correspond to mock-inoculated controls using 20, 25 and 30 amplification cycles. Thirty cycles were used for amplifications in lanes 4-7. L1, L2 and L3 correspond to the leaves with different phenotypes of photobleaching shown in the panel b. The relative (%) accumulation of pds mRNA in relation to mock-inoculated leaves is indicated below each lane.

