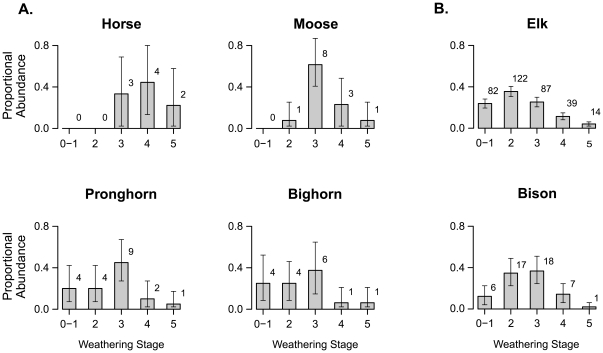
Figure 4. Frequency distributions of bone weathering stages (WS) for Yellowstone ungulates.
The death assemblage faithfully documents species' population histories including those that experienced (A) sharp historical declines in population size and (B) recent and less severe or punctuated population changes. Numbers associated with bars are counts of individuals (MNI), error bars are bootstrapped 95% confidence intervals. For historical population data, see Figure 1; bighorn population reduction occurred in 1982 [43]. The newly arrived mountain goat was not encountered in the death assemblage. Weathering Stage values (0 to 5) represent increasing degrees of weathering as a function of postmortem exposure (scale adapted from [22]). Yellowstone bones remain in WS0 for brief periods of time, typically less than a year, and thus individuals composed of such bones are pooled with individuals in WS1 (representing up to ∼6 years postmortem in Yellowstone) to increase sample size and better approximate cohorts of death. Historical drops in populations are evident in the relative frequency of bone weathering stages. For example, the locally extirpated species (horse), which has had negligible input of bones since the 1920's, has no individuals in the initial WS categories. Species whose populations declined within the 15–20 years prior to the 2005–2007 bone survey (moose, pronghorn) are represented by bones that include fresh input but MNI are mostly in WS3; these are ghosts of past higher rates of bone input (higher populations). The peak bighorn frequency in WS3 is not significant: on this cold-temperate landscape, bones generated >25 years ago have lower survival rates, making it difficult to discern older fluctuations in populations size, such as the severe 1982 bighorn population crash. Recent increases in bison populations have been obscured by removal of culled animals (see text).

