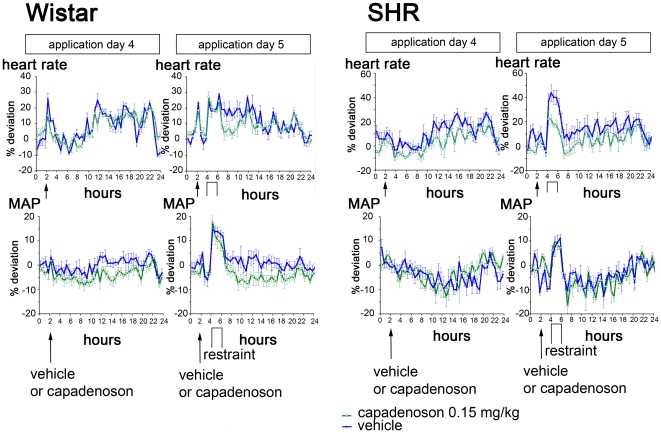
Figure 2. Telemetry data from Wistar and SHR during restraint experiment.
Shown are the mean heart rate (as percent deviation from resting normal), and mean arterial pressure the day before, and on the day of the experiment. Blue lines depict vehicle-treated animals, green lines capadenoson-treated animals (0.15 mg/kg). Shown on the left side are data from Wistar rats (heart rate, above; MAP, below), on the right side the corresponding values from SHR. Wistar: vehicle and capadenoson each n = 20. SHR: vehicle and capadenoson each n = 12.

