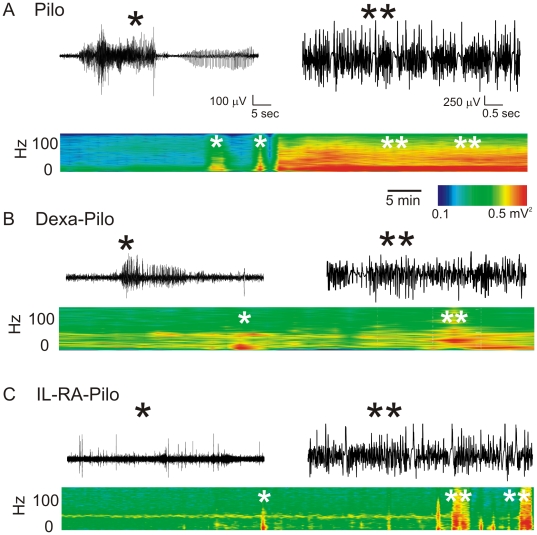
Figure 2. Time-joint frequency analysis of EEG recordings.
(A–C) Single asterisk refers to the first seizure episode. The double asterisk shows the maximal electrographic and behavioral seizures observed under any given condition. The actual EEG recordings are also shown. Time-joint frequency plots show a reduction of seizure intensity (frequency and amplitude domains, color coded) in treated animals compared to pilocarpine alone. Data shown refer to 2 hours of EEG recordings. See also Figure S2 for peak area distribution and instantaneous frequency analysis.

