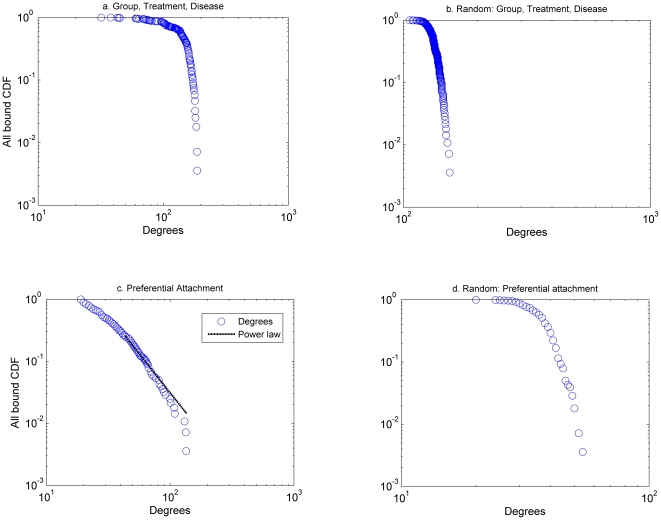
Figure 3. Connectivity distributions for different network configurations.
The connectivity distribution for the shared characteristics network of group, treatment and disease (a) is described by a single scale distribution. The connectivity distribution for the preferential attachment network (c) is described by a power law distribution (The power law is of the form  , with α = 2.83, xmin = 27, and p value = 0.138). For brevity, we do not include the shared characteristics networks generated by the: group, treatment; group, disease; disease, treatment.

