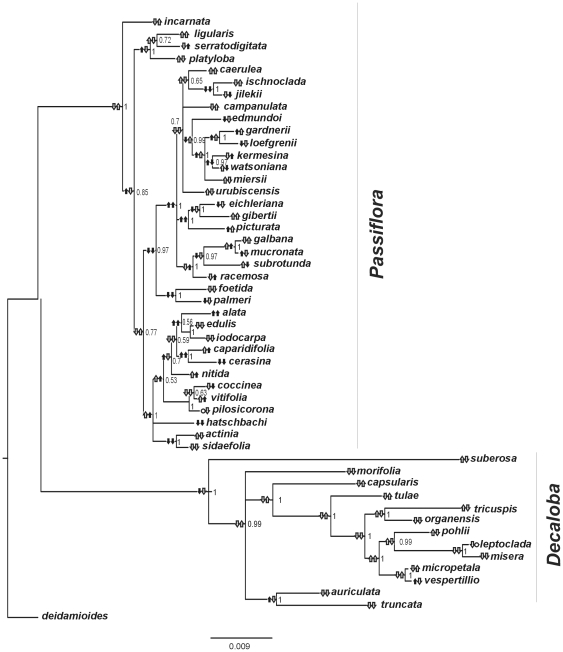
Figure 1. Genome size evolution in Passiflora.
Bayesian consensus tree based on the concatenated sequences of four chloroplast genes, taking in account the substitution models of each partition. Besides each ancestral node is a fraction number representing its posterior probability. Arrows beside each node represent genome sizes (left) and flower diameters (right). Arrows pointing up mean that there was an increase in average values of GS or FD. Arrows pointing downwards signify a downturn, comparing with the immediately anterior node. Circles represent identical means. Measurements or inferences significantly different than those obtained for the anterior node are represented in black. Measurements not significantly different are represent in white. The inferred values of GS and FD for each ancestral node are shown in Table S3 and Figure S5.

