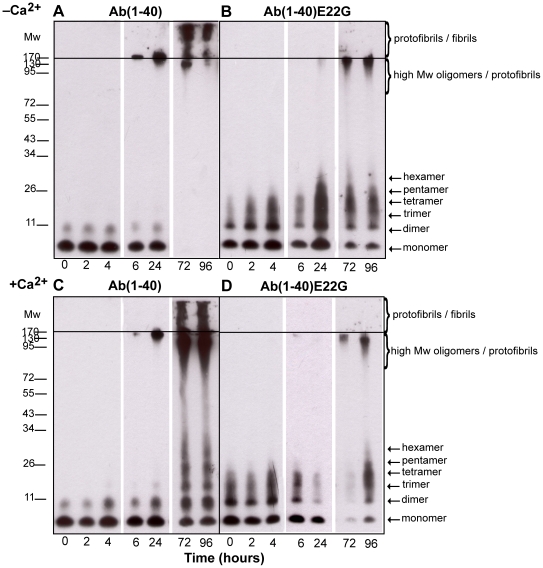
Figure 1. Aggregation profiles of Aβ(1–40) and Aβ(1–40)E22G by Western blot analysis.
Aggregation profiles of Aβ(1–40) and Aβ(1–40)E22G during 96 h of incubation in the presence or absence of added Ca2+ were followed using Western blot analysis. Samples were separated using gel electrophoresis on a 12% bis-Tris gel. For each condition, samples were taken at t = 0, 2, 4, 6, 24, 72, and 96 h. Following the loading of 1 µg of protein sample into each lane, the membrane was probed with a mixture of monoclonal antibodies 6E10 and 4G8 that recognize residues 1–17 and 17–24, respectively. Panels A and B are representative Western blots of Aβ(1–40) and Aβ(1–40)E22G in phosphate buffer (“–Ca2+ condition”), respectively. Panels C and D are representative Western blots of Aβ(1–40) and Aβ(1–40)E22G in 2 mM Ca2+ (“+Ca2+ condition”), respectively. At least four separate experiments were carried out to confirm these results. All images were taken from a single 96-h experimental procedure.

