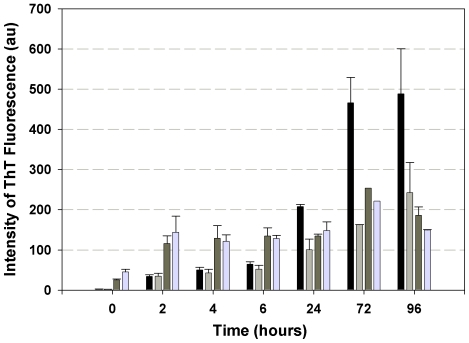
Figure 2. Oligomers and fibrils formation differentiated by ThT fluorescence.
ThT fluorescence intensity was monitored to follow fibrillogenesis of Aβ(1–40) and Aβ(1–40)E22G in the presence and in the absence of 2 mM Ca2+. Black bars, Aβ(1–40) in phosphate buffer (“–Ca2+ condition”); light grey bars, Aβ(1–40) in 2 mM CaCl2; dark grey bars, Aβ(1–40)E22G in phosphate buffer; light blue bars, Aβ(1–40)E22G in CaCl2. Shown are averages of values obtained in four independent experiments; error bars indicating the standard error of the average.

