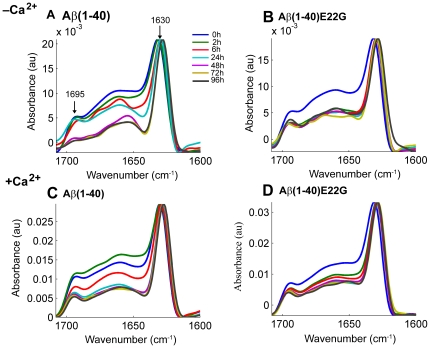
Figure 3. ATR-FTIR spectra of Aβ(1–40) and Aβ(1–40)E22G.
FTIR spectra of Aβ(1–40) and Aβ(1–40)E22G were taken in the presence and in the absence of added Ca2+, showing the amide I region of the spectra (1600–1700 cm−1). Aliquots of 2 µl were taken from each sample at t = 0, 2, 6, 24, 48, 72, and 96 h (shown in blue, green, red, cyan, purple, mustard, and dark blue, respectively). The data shown here were collected in one continuous experiment and are representative of three independent trials.

