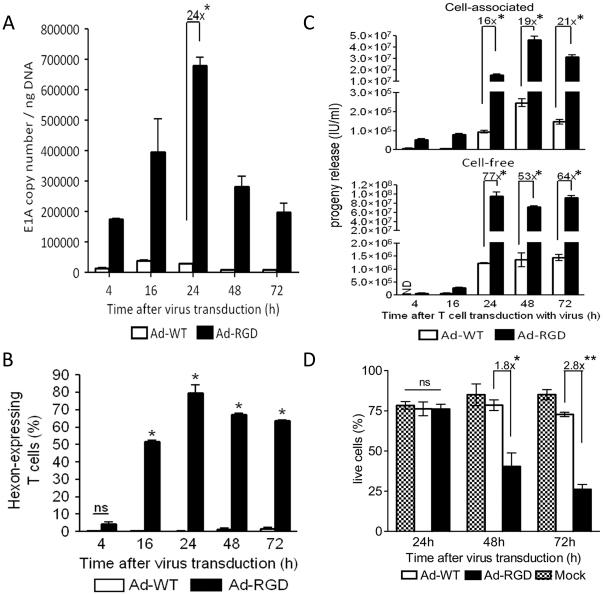
Figure 3. Evidence of adenovirus replication in Ad-RGD transduced T cells.
(A) Increased adenoviral E1A gene copy number in Ad-RGD treated cells (black bar) in comparison to Ad-WT treated cells (white bar) at different time-points after virus transduction calculated by qPCR. 24-fold higher viral E1A gene copy number was observed in Ad-RGD treated cells versus Ad-WT transduced cells at 24 h time-point (*p<0.001). (B) Bar diagram of flow-cytometric analysis showing percentage of T cells expressing viral hexon antigen at different time-points after virus transduction. Ad-RGD transduced T cells are represented by black bars and Ad-WT treated cells by white bars. (*p<0.0001; ns not significant). (C) Viral progeny was measured from cell lysate (cell-associated; upper panel) and culture supernantant (cell-free; lower panel) of adenovirus infected T cells. 16- to 21-fold increase in viral progeny was measured in T cell lysates and 64- to 77-fold higher viral progeny was observed in cell-free fractions of Ad-RGD treated cells (black bars) when compared to cells treated with Ad-WT (white bars) at different time-points after virus transduction (p<0.001; ND not detected). (D) Viability of virus-transduced T cells was assessed by Annexin/7AAD exclusion method. Frequencies of Annexin/7AAD double negative cells observed in flow-cytometry were plotted in a bar diagram. 1.8-fold and 2.8-fold higher death of Ad-RGD transduced T cells (black bars) was observed at 48 and 72 h after virus transduction respectively, when compared to Ad-WT transduced T cells (white bars). Mock (patterned bars) and Ad-WT showed similar viability through the entire time-course observation (*p<0.05; **p<0.001; ns not significant). Error bars represent mean ± SD.

