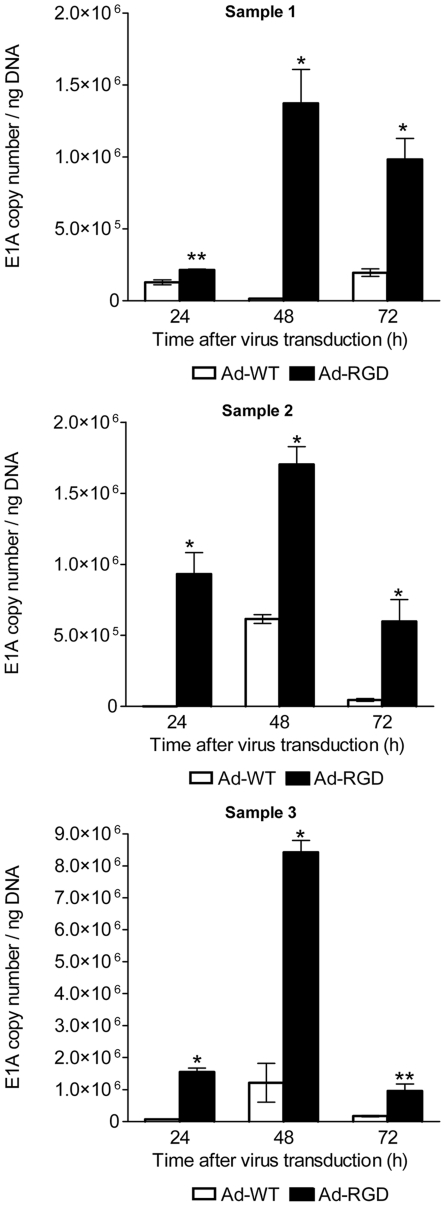
Figure 4. Adenoviral E1A copy numbers in transduced human CD8+ T cells.
Increased adenoviral E1A gene copy number in Ad-RGD treated cells (black bar) in comparison to Ad-WT treated cells (white bar) at different time-points after virus transduction calculated by qPCR. Samples 1–3 are three independent experiments. (*p<0.001; ** p<0.05). Error bars represent mean ± SD.

